


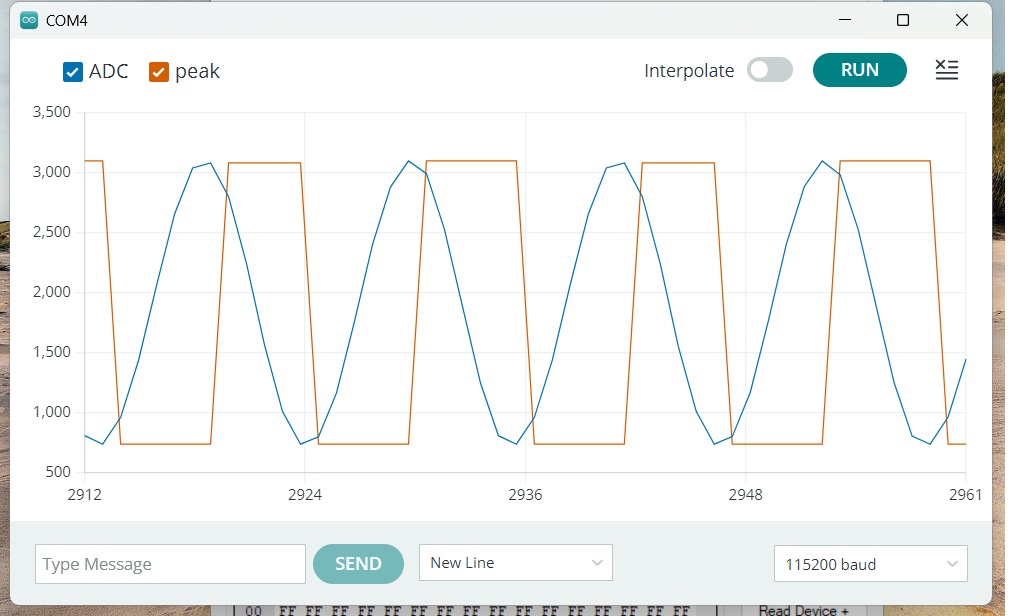
the output is intended to be plotted in the freely available easy to use arduino plotter, the average human will have nil chance of interpreting the data with such a small number of samples. if your load current is sinusoidal is should look similar to thisI can't still figure out what I'm reading.

 Reply With Quote

Bookmarks